


I switched my primary blog from a dynamic app-server based one to a static site around three or four years ago. While I was happy to let go of the stress and worry of maintaining an app server, a database server, and a web server, one of the things I missed was a stats based view of my content. I've been a Google Analytics user for years (although I've recently dropped it for Netlify Analytics) but that focuses on how people use my site. The stats I want involve more the nature of my content. So for example, how often am I publishing? What categories do I cover and how have they changed over time.
In a "regular" app server context (and maybe this is no longer the norm), I'd write a page with a few SQL queries and be done with it. In a JAMstack site, though, I can't really do that. In this article, I want to show how you can create a page that gives you this kind of data about your content on a JAMstack site built using Eleventy.
Some background
The first static site generator I used for my blog was Hugo, and back in late 2016 I wrote up my experience building a "stats viewer" with it: "A Simple Stats Script for Hugo". I wasn't able to accomplish what I wanted using Hugo itself, so my solution was a custom Node script that would output a JSON packet of stats. I had to generate it manually and then copy it to my site. Finally, I used some client-side JavaScript to display the results. As the stats were just for me, I'd run the script every now and then when I wanted to ensure I was seeing the latest information.
I've since moved to Jekyll and worked on an updated version: "Building a Stats Page for Jekyll Blogs". My solution was able to use Jekyll itself to generate the stats, which means it's always up to date when I add new content. If you read the linked article you'll see I did run into a bit of trouble. While the template language is powerful in Jekyll, I still had to make some compromises with my data. For example, you'll see that I output a large array of dates for every post I've published and handle the cleanup on the client.
Recently I've discovered 11ty and to say I've fallen for it would be an understatement. It's incredibly flexible, fast and is Node-based. I really like Jekyll, but the fact that it is Ruby-based has been problematic for me in the past when setting up on Windows. I've had no such issues with 11ty. While I'm not planning on migrating my personal site to 11ty just yet, it is absolutely going to happen eventually.
I decided to take a look at building a stats view for 11ty. What I'm going to share is rather rough (I didn't even bother to build a front end 😉), but I think it may be helpful. Also note that what I built is focused on a blog - specifically my blog - so depending on your content you will need to modify things a bit to suit your needs.
Preparing my content
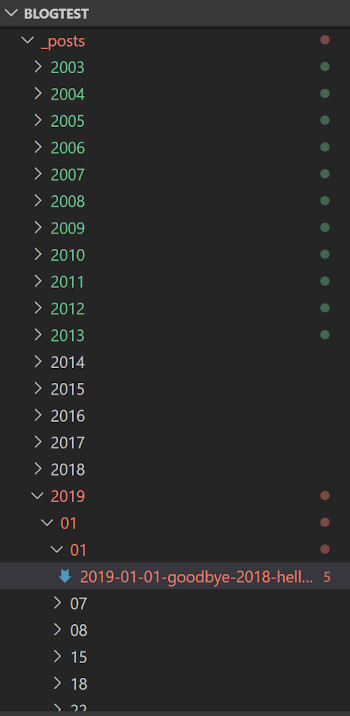
Before we begin, let's look at the site I started with. I copied my blog content (over six thousand posts) into a folder named _posts. This folder contains a directory for each year, a directory for each month, and a directory for each day. Individual posts exist in those day-named subdirectories.
Now that I had 6000+ posts, I needed a way for 11ty to recognize them as "special" as opposed to other random pages on my site. For example, while the test site didn't include anything else, my regular site would have an "About" page, a "Contact" page, and so forth. I do not want these pages included in the statistics.
Out of the box, 11ty has a "Collections" feature that organizes content. One way it does this is via tags. So if five pages had the tag "Cat", they would be in the "Cat" collection. But, for a blog (or at least my blog), there wasn't one tag that was used in every single post. Instead, every post has a tag specific to the content inside.
Luckily, 11ty makes it easy to create collections dynamically, especially from a file path. I created an .eleventy.js file and defined my new collection like so:
module.exports = function (eleventyConfig) {
  eleventyConfig.addCollection('posts', (collection) => {
    return collection.getFilteredByGlob('_posts/**/*.md');
  });
};This creates a new collection called posts that I can use as a base for my stats. So far, so good.
Generating data
I then decided to use another 11ty feature, "Data", to generate my stats data so that I could make use of it in a regular page. However, I then discovered something interesting. While you can use JavaScript to create custom data sources, those scripts do not have access to collections or other parts of 11ty itself. The result of their code becomes part of the data you can use in pages, but the code itself, when run, does not have access to it. In theory I could mimic what getFilteredByGlob does and get the same set of files. But I wouldn't have access to parsed files. When 11ty adds a file to a collection, it parses the front matter. My data file could do this too, but this felt like a lot of duplication of effort and just... I don't know, felt wrong.
At this point I figured I'd need to try to generate the data in a template, like I did for my Jekyll solution. As I said, it "worked" but it was a bit difficult to get my data precisely how I wanted. Jekyll's template language, Liquid, is nice and flexible, but I didn't want to just copy and paste my code. I then remembered that 11ty supports EJS. EJS is an older template language, and frankly, I don't like it. I used it a lot when I was first learning to work with static sites as it was one of two options for Harp (a static site generator that's no longer in development). As the other option was Jade, a language I truly despise, I "settled" for EJS. Writing in EJS feels like using old school ASP. It's ugly, but extremely flexible.
The more I thought about it, the more I thought EJS may actually be best suited for this. I needed to parse my data and get lots of different stuff out of it, and EJS's flexibility may work out great. My solution worked well. The code is ugly, but it works, and I'll take it. Before I share it, here's the stats that I generated. To be clear, this is somewhat arbitrary for what I thought was important, I assume your needs may differ.
- The total number of posts.
- The first and last post. Obviously the first post never changes, but I like seeing this.
- The total number of words. (This one's truly silly, but kinda fun.)
- How many posts are in a category and tag. For my blog I use both as a way to organize my content.
- Total number of posts per year, month, and day.
- The average word count per blog. In the beginning, I used my blog for things like "Here's a cool link" or "Here's a cool event". Most of those shorter posts are now things I tweet instead.
Here's the script, and again, forgive the ugliness.
---
permalink: /stats.json
---
<%
function wordCount(s) {
    return s.split(/\s+/).length;
}

totalPosts = collections.posts.length;
totalWords = 0;

let tags = {};
let categories = {};
let years = {};
let months = [];
let days = [];

collections.posts.forEach((p,i) => {
    if(i === 0) firstPost = p;
    if(i === collections.posts.length-1) lastPost = p;
    p.data.tags.forEach(t => {
        if(!tags[t]) tags[t] = 0;
        tags[t]++;
    });

    p.data.categories.forEach(c => {
        if(!categories[c]) categories[c] = 0;
        categories[c]++;
    });

    //Add to the yearly stat
    let year = new Date(p.date).getFullYear();
    if(!years[year]) years[year] = 0;
    years[year]++;

    let month = new Date(p.date).getMonth();
    if(!months[month]) months[month] = 0;
    months[month]++;

    let dow = new Date(p.date).getDay();
    if(!days[dow]) days[dow] = 0;
    days[dow]++;

    totalWords += wordCount(p.templateContent);
});

let avgWords = totalWords / totalPosts;

%>

{
    "totalPosts": <%= totalPosts %>,
    "totalWords": <%= totalWords %>,
    "avgWords": <%= avgWords %>,
    "firstPost": {
        "title": "<%= firstPost.data.title %>",
        "date": "<%= firstPost.date %>"
    },
    "lastPost": {
        "title": "<%= lastPost.data.title %>",
        "date": "<%= lastPost.date %>"
    },
    "tags": <%- JSON.stringify(tags) %>,
    "categories": <%- JSON.stringify(categories) %>,
    "years": <%- JSON.stringify(years) %>,
    "months": <%- JSON.stringify(months) %>,
    "days": <%- JSON.stringify(days) %>
}The first half of the script handles iterating over my posts, one by one. I iterate over each category and tag, count the words, and then parse out the dates. The second half of the template outputs the resulting JSON. If you look back on top, you can see I use a permalink value to specify that to output to JSON.
To test this data, I created a quick Vue.js template to work with the JSON. As much as I don't like using EJS, I decided to use it again. Why? While I prefer Liquid templates (the engine Jekyll uses), it uses the same tokens that Liquid uses for data. That means using Liquid to generate Vue can be... tricky. Using EJS means I can simply not worry about it. Here's an incredibly bare bones viewer.
<style>
  [v-cloak] {
    display: none;
  }
</style>

<h1>Stats View Test</h1>

<div id="app" v-cloak v-if="stats">
  <h2>Basic Stats</h2>
  <ul>
    <li>Total Posts: {{ stats.totalPosts }}</li>
    <li>Total Words: {{ stats.totalWords }} (average per post: {{ stats.avgWords }})</li>
    <li>First Post: {{ stats.firstPost.title }} ( {{ stats.firstPost.date }} )</li>
    <li>Last Post: {{ stats.lastPost.title }} ( {{ stats.lastPost.date }} )</li>
  </ul>

  <h2>Categories</h2>
  <ul>
    <li v-for="(count,cat) in stats.categories">{{ cat }} ({{count}} posts)</li>
  </ul>

  <h2>Tags</h2>
  <ul>
    <li v-for="(count,tag) in stats.tags">{{ tag }} ({{count}} posts)</li>
  </ul>

  <h2>Years</h2>
  <ul>
    <li v-for="(count,year) in stats.years">{{ year }} ({{count}} posts)</li>
  </ul>

  <h2>Months</h2>
  <ul>
    <li v-for="(count,month) in stats.months">{{ month }} ({{count}} posts)</li>
  </ul>

  <h2>Day of Week</h2>
  <ul>
    <li v-for="(count,dow) in stats.days">{{ dow }} ({{count}} posts)</li>
  </ul>
</div>

<script src="https://cdn.jsdelivr.net/npm/vue/dist/vue.js"></script>
<script>
  const app = new Vue({
    el: '#app',
    data: {
      stats: null
    },
    created() {
      fetch('/stats.json')
        .then((res) => res.json())
        .then((res) => {
          console.log(res);
          this.stats = res;
        });
    }
  });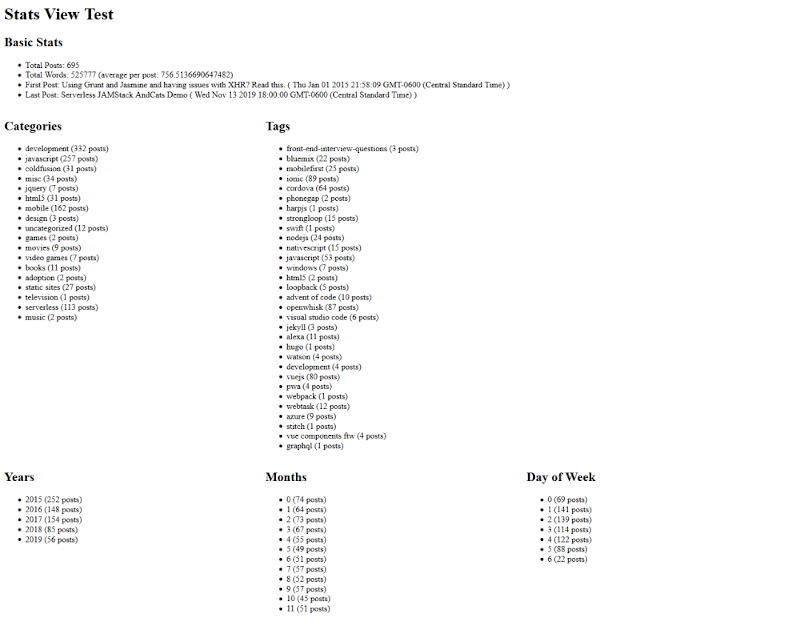
</script>I use simple HTML to report everything out. I could definitely use some fancy JavaScript charting to make it nicer, but plain text works well too. Here's a screenshot (note that I'm using .eleventyignore to ignore about 80% of my post content, this makes my testing a bit quicker but the stats you will see here don't represent the complete source of my blog).
Where to go from here
To say this could be prettier is an understatement. My cat could probably make a nicer looking page, but hopefully you get the idea. Next steps could be improving the front-end and expanding the types of statistics I collect. If you want a copy of this code, you can grab it from here: https://github.com/cfjedimaster/eleventy-demos/tree/master/blogtest. How to create a page that gives data about your content on a JAMstack site built using Eleventy.